Why Use Filters?
Filters allow you to narrow down your chart data so you only see what matters most. Instead of plotting everything, you can apply conditions to focus on particular time periods, categories, or values.- Focus on specific segments of your dataset.
- Remove unnecessary or irrelevant values.
- Create cleaner, more insightful charts.
- Compare different subsets of your data side by side.
Filters don’t delete your data—just refine what’s displayed in the chart.
Adding a Filter
Click the Edit button from a chart menu to open the Chart Composer.Then you can apply filters to the columns directly from the tabular data section at the bottom of the Chart Composer.
- Filter by Value
- Filter by Condition
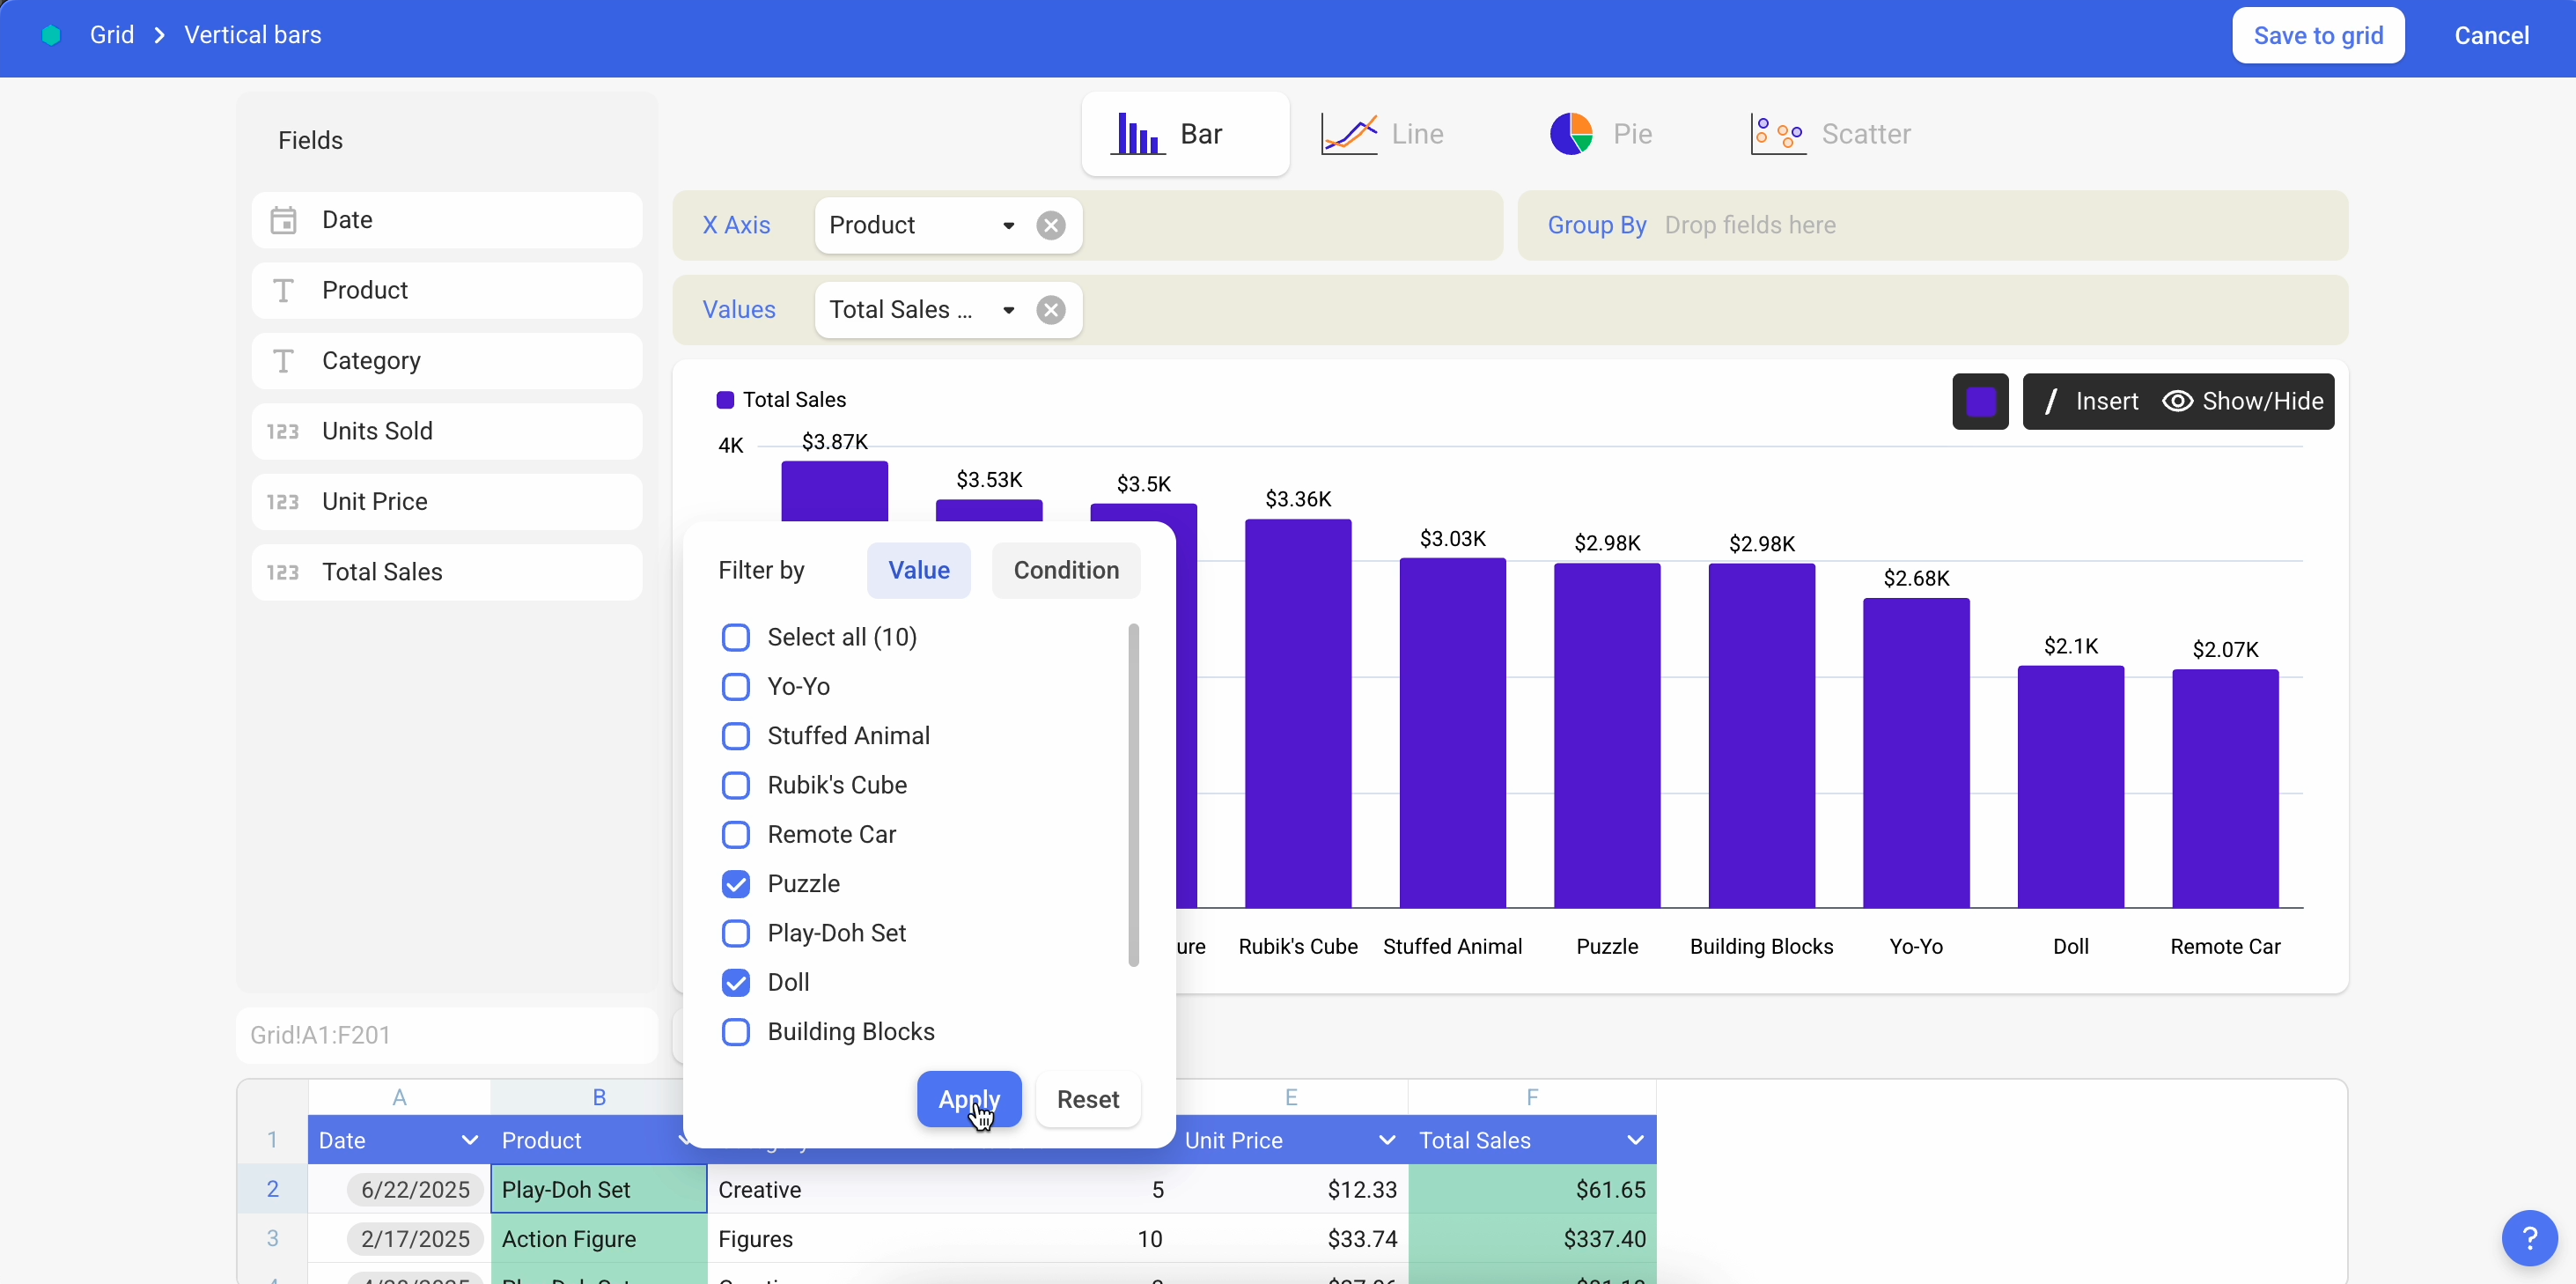
Filter by Value
- Open the Chart Composer (click the Edit button from a chart menu).
- Locate the tabular data section at the bottom of the composer.
- Click the Down Arrow button on the column you want to filter.
- Choose Filter by Value.
- Select one or multiple values from the list.
- Click Apply.
- The chart updates instantly to show only the selected values.
Filter by Condition
- Open the Chart Composer.
- Locate the tabular data section at the bottom of the composer.
- Click the Down Arrow button on the column you want to filter.
- Choose Filter by Condition.
- Select a condition based on the column type (e.g., Is equal to, Greater than, Less than, Is between).
- Enter the condition value.
- Click Apply.
- The chart updates instantly to reflect the condition.
There will be a green mark on the column where filter is applied.
Editing or Removing Filters
- Edit a filter → Click the Filter button again on the column. Change condition, or value and apply the change.
- Remove a filter → Click the Filter button again on the column. Then click Reset button to remove the applied filter.
Saving Charts with Filters
Charts can be edited on both Grids and Boards.Depending on where you are working, you will see different save options:
- Save to Grid → Updates the chart inside your Grid.
- Save to Board → Updates the chart inside your Board.
Related Guides
- Learn more about Sorting in Bricks
- See how to Apply Grouping in Chart Composer
- Explore Available Chart Types in Bricks
- Learn more about Filtering Grid Data
Need Help?
For additional assistance with Charts or any feedback:- Use the in-app support chat: Help > Start a conversation
- Join our Discord Community
- Or email support@thebricks.com